Vancouver WA & Clark County Housing Market Report 2026
Vancouver, WA & Clark County Real Estate Market Report 2026: Home Prices, Inventory & What's Next
Prices are holding, homes are taking longer to sell, and buyers have more room to negotiate. Here's what the latest numbers mean for buying or selling in Vancouver, WA and across Clark County, ZIP code by ZIP code, explained by a local Realtor.

"Is the market crashing?" "Should I wait?" "Is now a bad time to sell?" I get some version of these questions every week. Headlines about the national market don't help much, because Clark County moves on its own schedule.
So instead of headlines, here are the actual local numbers: county-wide sales from RMLS, the regional MLS that covers Clark County, plus a ZIP-code breakdown for the City of Vancouver, along with what I'm seeing on the ground with my buyers and sellers. I update this report every year (and refresh the numbers as new data comes out), so you can bookmark it and watch the trend.
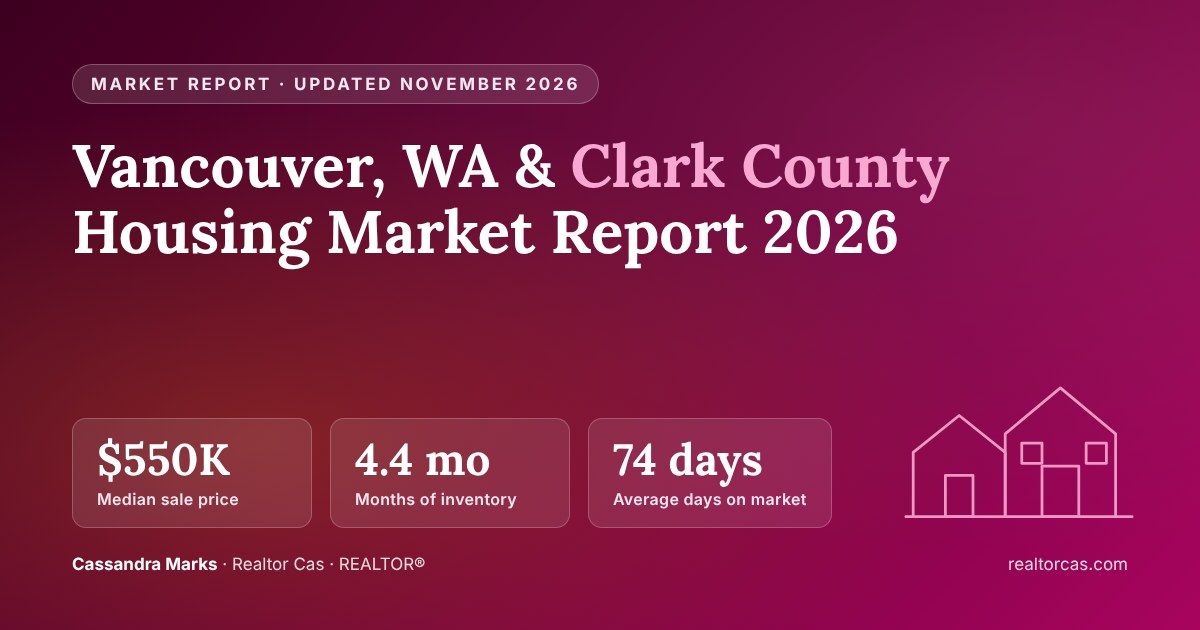
Clark County Housing Market Numbers: October 2026
These are the latest county-wide figures for all residential sales in Clark County. Month-over-month changes compare October with September 2026.
| Measure | October 2026 | vs. Last Month | vs. Last Year |
|---|---|---|---|
| Median sale price | $550,000 | +0.1% | +2.0% |
| Average sale price | $627,300 | +2.6% | +0.7% |
| Months of inventory | 4.4 | Up from 4.3 | Up from about 3.6 |
| New listings | 613 | −5.8% | −6.4% |
| Pending sales | 438 | −15.9% | −16.9% |
| Closed sales | 480 | −6.3% | −9.4% |
| Average days on market | 74 days | Total market time | |
For quick monthly updates between reports, check my Vancouver market snapshot. Data source: RMLS Market Action, October 2026.
Vancouver, WA Housing Market by ZIP Code
Short answer: Vancouver isn't one market. In early November 2026, median list prices ranged from about $490,000 near downtown (98660) to $770,000 in west Vancouver (98685), and the typical home sat anywhere from 42 to 112 days. East Vancouver (98682) had the most homes for sale, with 173 active listings.
| ZIP code | Median list price | Price per sq ft | Median days on market | Active listings |
|---|---|---|---|---|
| 98660 | $489,900 | $310 | 98 | 29 |
| 98661 | $495,000 | $308 | 70 | 77 |
| 98662 | $519,999 | $286 | 42 | 71 |
| 98682 (East Vancouver) | $550,000 | $296 | 56 | 173 |
| 98663 | $559,000 | $273 | 63 | 35 |
| 98684 | $571,523 | $287 | 60 | 62 |
| 98665 | $577,400 | $319 | 91 | 50 |
| 98664 | $582,000 | $307 | 91 | 60 |
| 98683 | $617,500 | $312 | 77 | 62 |
| 98686 | $689,000 | $308 | 77 | 111 |
| 98685 (West Vancouver) | $770,000 | $307 | 112 | 95 |
These are asking prices for homes currently for sale, not closed sales, so they show where sellers are pricing today. The county figures above are closed sales. ZIP data comes from Altos Research (via The Tartan Team).
Clark County Real Estate: October 2025 vs. October 2026
Short answer: Prices are slightly higher than a year ago, but fewer homes are going under contract and buyers have more to choose from. The biggest change isn't price, it's pace.
| Measure | October 2025 | October 2026 |
|---|---|---|
| Median sale price | About $539,000 | $550,000 |
| Months of inventory | About 3.6 | 4.4 |
| New listings | 655 | 613 |
| Pending sales | 527 | 438 |
| Closed sales | 530 | 480 |
| 30-year mortgage rate (mid-November) | 6.24% | 7.11% |
Notice that new listings actually went down. Inventory isn't rising because a flood of sellers showed up; it's rising because homes are selling more slowly. I wrote more about that in Clark County's inventory is rising faster than demand.
Is Clark County a Buyer's Market or a Seller's Market?
Short answer: It's a balanced market that's leaning toward buyers. A common rule of thumb is that under about 4 months of inventory favors sellers, 4 to 6 months is balanced, and over 6 months favors buyers. At 4.4 months, Clark County just crossed into balanced territory for the first time in a long while.
- Prices are steady, not dropping. The median is up 2.0% year over year and basically flat month to month. Well-priced homes are still selling.
- Demand is cooling. Pending sales, the best early signal of where closings are headed, are down almost 17% from last year. Expect slower closings through winter.
- The top of the market is holding up. The average price rose 2.6% in a month, which usually means more higher-priced homes closed.
- Homes need the right price. At 74 days on market on average, overpriced listings sit, and they often end up selling for less after price cuts.
How Mortgage Rates Are Shaping the Clark County Market
Short answer: Rates are the main reason sales slowed. Freddie Mac's 30-year average was 7.11% on November 12, 2026, compared with 6.24% a year earlier. On the same $550,000 home, that difference costs a buyer roughly $254 more a month.
| Rate | Monthly principal & interest |
|---|---|
| 6.24% (November 2025) | About $2,706 |
| 7.11% (November 2026) | About $2,960 |
Property taxes (roughly $445 a month on a $550,000 home in most of the City of Vancouver, based on Clark County's 2026 tax rates), insurance, and any HOA come on top. Run your own numbers on my Vancouver mortgage calculator, and see how mortgage rates affect your buying power and why more inventory can matter more than a small rate drop.
Rates come from Freddie Mac's Primary Mortgage Market Survey. For a statewide view, the Washington Center for Real Estate Research at the University of Washington tracks housing trends across Washington.
What the Clark County Market Means for Buyers
Short answer: You have more choice, more time, and more negotiating power than buyers have had in years. The trade-off is a higher rate, so focus on the monthly payment and use seller credits to soften it.
- Negotiate. Ask for seller-paid closing costs or a rate buydown, especially on homes that have been listed 30+ days.
- Look at new construction. Builders in Clark County are offering rate buydowns and closing credits. Start with new construction vs. resale and what's in a builder's rate buydown.
- Get your financing ready first. Sellers take credit requests more seriously from pre-approved buyers. My step-by-step guide on what to do before buying a home in Vancouver, WA walks you through it.
- Check loan limits. The 2026 conforming limit is $832,750 (FHFA) and the Clark County FHA limit is $701,500 (HUD); 2027 limits are announced late this year.
What the Clark County Market Means for Sellers
Short answer: Your home is still worth about what it was a year ago, but it won't sell itself. Pricing right from day one, solid prep, and being open to credits matter more now than at any time in the last few years.
- Price for today's market, not last spring's. Read overpricing vs. underpricing and my guide to pricing your Vancouver home.
- Prep and presentation count. See how to make your home more marketable and whether to sell as-is or make repairs first.
- Offer a credit instead of a big price cut. A seller-paid rate buydown can do more for a buyer's payment than the same dollars off the price.
- Timing matters. Most buyers shop in spring, but serious winter buyers face less competition. See the best time to sell a home in Vancouver, WA.
Clark County Communities: Where Each Market Stands
Short answer: The county-wide numbers hide big differences. Camas and parts of east Vancouver run well above the county median, while central Vancouver and parts of north county are more affordable. Here's where to dig deeper on each area.
Vancouver
The county's largest market (see the ZIP code table above), with everything from downtown condos to Felida and Fisher's Landing family neighborhoods. Explore the Vancouver neighborhood guide, browse homes for sale in Vancouver, or compare east vs. west Vancouver and Fisher's Landing vs. Felida.
Camas
Consistently one of the highest-priced markets in the county, with strong schools and a walkable downtown. The $1M+ segment has the most inventory right now. See homes for sale in Camas and my pros and cons of living in Camas.
Ridgefield
One of the fastest-growing cities in the county, with lots of new construction. See homes for sale in Ridgefield, new construction in Ridgefield, and Ridgefield vs. Camas.
Battle Ground
More space for the money, popular with families. See homes for sale in Battle Ground, new construction in Battle Ground, and why Battle Ground works for families.
Washougal
Gorge access and often a lower price point than neighboring Camas. See homes for sale in Washougal and is Washougal worth moving to?
Brush Prairie & Hockinson
Acreage and rural living close to Vancouver. See homes for sale in Brush Prairie, homes for sale in Hockinson, and country or city living in Brush Prairie.
La Center & Woodland
North county towns with growing new-home communities. See new construction in La Center and the La Center & Woodland guide.
What to Watch in the Clark County Market in 2027
Short answer: Watch mortgage rates and spring inventory. Nobody can promise where rates go, but if they ease, the buyers sitting on the sidelines now are likely to come back quickly, and the leverage buyers have today could shrink.
- Mortgage rates: the single biggest factor in how many homes sell. Track them weekly on Freddie Mac's survey.
- Spring listings: more homes usually hit the market from March through May. If inventory climbs past about 5 to 6 months, expect more price cuts.
- 2027 loan limits: new conforming and FHA limits take effect January 1.
- The I-5 Bridge: tolling is now expected to start in 2028 at the earliest. See my I-5 Bridge update.
- Full-year 2026 data: I'll update this report when RMLS releases year-end numbers in January.
How to Read a Real Estate Market Report
| Term | What it means |
|---|---|
| Median sale price | The middle price: half of homes sold for more, half for less. It's the best single measure of typical prices. |
| Median list price | The middle asking price of homes currently for sale. It shows where sellers are pricing today, before any negotiation. |
| Average sale price | Total sales divided by the number of homes. A few expensive sales can pull it up, so it moves more than the median. |
| Months of inventory | How long it would take to sell every active listing at the current pace of sales. Higher means more choice for buyers. |
| Pending sales | Homes that went under contract. It's an early signal of future closed sales. |
| Closed sales | Homes that finished closing in that month. |
| Days on market | How long homes were listed before going under contract. RMLS reports total market time. |
Vancouver, WA & Clark County Real Estate Market: Common Questions
What is the median home price in Clark County, WA?
What is the median home price in Vancouver, WA?
Is Clark County a buyer's market or a seller's market?
Are home prices dropping in Clark County?
How long does it take to sell a house in Clark County?
Why are fewer homes selling in Clark County?
Is now a good time to buy a home in Clark County?
How often is this Clark County market report updated?
Sources
- RMLS (Regional Multiple Listing Service): Market Action, Clark County, October 2026
- Altos Research data for Vancouver, WA ZIP codes, week of November 6, 2026 (via The Tartan Team)
- Freddie Mac: Primary Mortgage Market Survey
- University of Washington: Washington Center for Real Estate Research
- Federal Housing Finance Agency: Conforming Loan Limits
- HUD: FHA 2026 Loan Limits
- Clark County Treasurer: Tax Rates
Payment examples are estimates calculated from the rates shown and exclude taxes, insurance, and HOA dues unless noted.
Thinking About Buying or Selling in Vancouver or Clark County? 📊
Numbers are a starting point. I'll show you what they mean for your neighborhood, your budget, and your timeline, with no pressure.
Get Your Home Value Book a Buyer Discovery Session Call (503) 884-2387
Categories
Recent Posts






GET MORE INFORMATION

Cassandra Marks
Realtor, Licensed in OR & WA License ID: 201225764
Realtor, Licensed in OR & WA License ID: 201225764